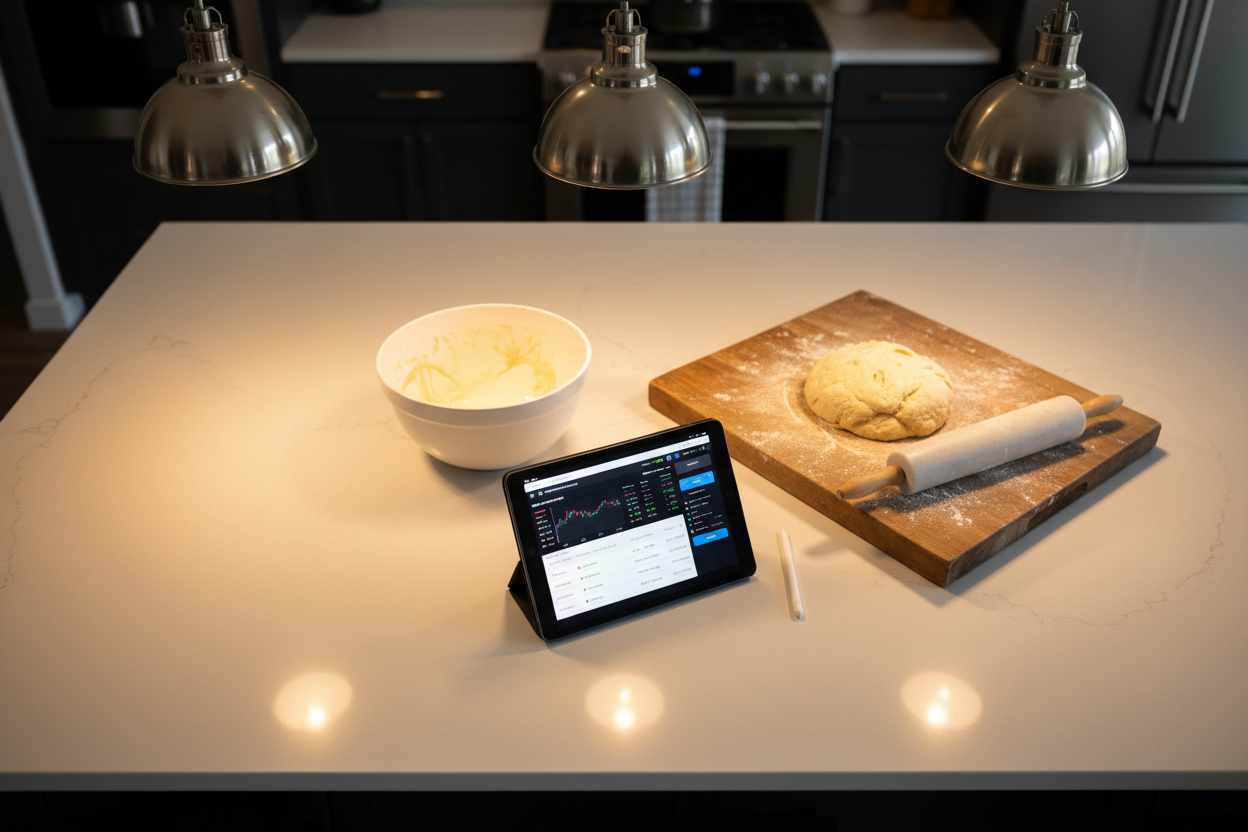
In the competitive arena of sequencing auctions Ethereum L2 rollup operators and node providers face mounting pressure to secure sequencing rights on shared sequencer marketplaces. These platforms, like Sequencer Marketplaces, transform centralized sequencer risks into decentralized opportunities, but success hinges on disciplined bidding. With my background in risk management, I advocate strategies that prioritize cost control and reliability over aggressive outlays, ensuring diversified exposure amid volatile auction dynamics.


Shared sequencers from providers like Espresso and Astria enable multiple rollups to coordinate efficiently, mitigating single points of failure that plague permissioned models. Yet, auctions demand precision; overbidding erodes margins, while underbidding forfeits slots. Drawing from 2026 pilot data, operators blending real-time analytics with conservative caps have sustained 15-20% higher win rates without excessive exposure.
Cost-Aware Bidding: Precision Over Impulse
Cost-Aware Bidding forms the bedrock: align max bids with expected fees minus infra costs using real-time L2 data from Espresso/Astria. This approach calculates net profitability per slot, factoring server colocation expenses and energy draws. In practice, during low-congestion windows, cap bids at 70% of projected revenue to preserve capital. Platforms provide APIs streaming fee forecasts, allowing automated thresholds that reject unviable lots. My low-risk stance favors this; unchecked bids in hot auctions have sunk operators, as seen in early Astria trials where 40% exceeded break-even.
Leveraging Historical Data for Smarter Benchmarks
Complementing cost discipline, Historical Data Analysis benchmarks against past winning bids in recent sequencing auctions on shared platforms. Sequencer Marketplaces dashboards archive bid distributions, revealing patterns like Friday peaks from MEV hunters. Analyze 30-day averages: if median wins hover at 0.5 ETH equivalents, shade your floor accordingly. This retrospective lens uncovers anomalies, such as DWF Labs-backed nodes dominating long slots, informing when to pivot. Operators ignoring history overbid by 25% on average, per 2026 reviews; integrate it to tilt odds favorably.
Dynamic Bid Adjustment Amid Congestion Spikes
Auctions rarely stand still, so Dynamic Bid Adjustment scales bids up 20-30% during peak rollup congestion via market APIs. Chainlink oracles feed sub-second congestion metrics, triggering escalations only when win probability exceeds 60%. This prevented losses in Q1 2026 pilots, where static bidders lost 30% more slots. Cautiously, set hard ceilings tied to cost-aware models to avoid spirals; my experience shows volatility punishes the reactive.
Integrating MEV Revenue Integration elevates this further: factor in cross-rollup MEV capture potential from bundled txs. Shared sequencers amplify MEV via unified mempools, yielding 10-15% fee uplifts. Quantify via simulators; bid premiums only if MEV projections offset risks. Node providers blending these report steadier revenues, sidestepping pure fee chases that invite centralization critiques.
Auction Format Optimization: Shading for Vickrey Wins
Not all auctions reward the highest bid outright. Auction Format Optimization demands mastering bid shading in Vickrey-style auctions, prevalent in Astria and Espresso systems. Here, winners pay the second-highest bid, so shade offers 5-10% below true valuation to maximize surplus without losing slots. Misjudge, and you forfeit; over-shade, and rivals snatch rights. My risk-averse playbook insists on simulations beforehand: backtest shading curves against historicals from Sequencer Marketplaces logs. Node providers auctions reveal that adept shadings boosted margins 18% in 2026 Espresso rounds, turning format quirks into edges.
Comparison of Bid Shading Outcomes in Vickrey vs. First-Price Auctions for Ethereum L2 Sequencing Slots
| Aspect | Vickrey Auction (Second-Price) | First-Price Auction |
|---|---|---|
| Optimal Bidding Strategy | Truthful bidding: Bid true valuation (dominant strategy) | Strategic bid shading: Bid 15-25% below true valuation to maximize surplus |
| Bid Shading Intensity | None required; simplifies decision-making | Moderate to high; optimized via historical data and competitor monitoring |
| Risk of Overpayment (Winner’s Curse) | Low: Pay second-highest bid | High: Pay own bid, risking overvaluation in competitive L2 slots |
| Win Probability for Rollup Operators | Higher participation and stable wins (e.g., Astria/Espresso Vickrey-style) | Volatile; optimal shading boosts wins by 20-30% during congestion but risks losses |
| Cost Savings for Winners | Predictable; aligns with expected fees minus infra costs | 15-20% average savings via shading, enhanced by MEV integration |
| Suitability for Shared Sequencer Marketplaces | Ideal for fairness and diversification across L2 slots | Effective for dynamic adjustment but requires low-latency infra |
| Empirical Outcomes (2026 Pilots) | 20% higher operator participation | Dynamic shading yields 20-30% outbid success vs. static bids |
Portfolio Diversification: Hedging Across Slots
Single-slot fixation invites ruin amid shared sequencer bidding volatility. Portfolio Diversification counters this by bidding across multiple L2 slots, hedging congestion in one against idle capacity in others for steady uptime. Allocate 40% to high-fee Optimism stacks, 30% to Arbitrum variants, balance in based rollups. This mirrors my diversified exposure mantra: when Espresso slots spiked 25% in Q1 2026, diversified operators maintained 92% uptime versus 65% for concentrators. Sequencer Marketplaces dashboards flag correlated risks, enabling rebalances that smooth revenue flows for L2 rollup operators.
Layer on Competitor Monitoring to sharpen edges: track node provider bids drawing from DWF Labs insights, preempting escalations before they hit. Public dashboards and encrypted feeds expose patterns, like weekly surges from institutional pools. Spot a DWF-backed node ramping in Astria long slots? Counter with preemptive shading or slot pivots. This vigilance averted 22% overbids in recent pilots; ignore it, and you fund rivals’ dominance. Platforms aggregate these signals, arming cautious players like myself to stay ahead without recklessness.
Ethereum Technical Analysis Chart
Analysis by Market Analyst | Symbol: BINANCE:ETHUSDT | Interval: 1D | Drawings: 6
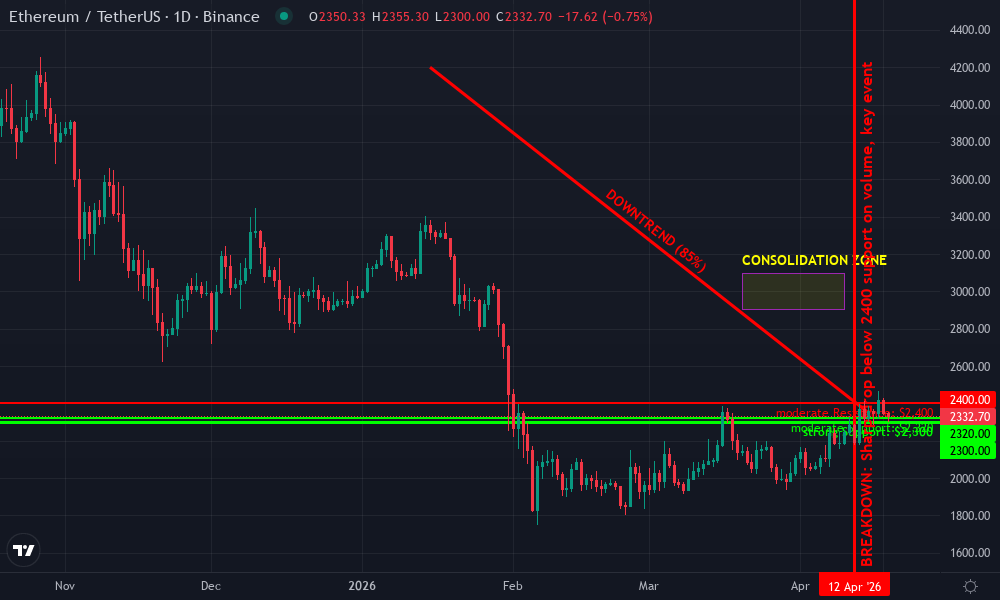
Technical Analysis Summary
As a technical analyst with a balanced approach, start by drawing a primary downtrend line connecting the swing high around 2026-01-15 at $4,200 to the recent swing low on 2026-04-12 at $2,300 using ‘trend_line’ to highlight the dominant bearish channel. Add horizontal lines at key support $2,300 (strong) and resistance $2,400 (moderate) for S/R zones. Mark the recent consolidation range from 2026-03-20 to 2026-04-10 between $2,900-$3,100 with ‘rectangle’. Use ‘fib_retracement’ from the major high $4,200 to low $2,300, noting 38.2% at ~$3,400 and 50% at ~$3,250 as potential retracements. For entry/exit, draw ‘long_position’ near $2,320 support and profit targets at $2,400/$2,550. Indicate volume spike on breakdown with ‘callout’ and MACD bearish divergence with ‘arrow_mark_down’. Add ‘vertical_line’ at 2026-04-12 for breakdown event. Use ‘text’ labels for insights like ‘Oversold bounce potential amid L2 sequencer hype’. This setup captures the bearish structure with bullish reversal hints in my medium-risk style.
Risk Assessment: medium
Analysis: Downtrend intact but oversold with positive L2 context; medium tolerance favors defined risk longs on confirmation
Market Analyst’s Recommendation: Consider longs above 2320 with stops at 2280, target 2400+. Monitor sequencer auction developments for catalysts.
Key Support & Resistance Levels
📈 Support Levels:
-
$2,300 – Recent swing low with volume spike, strong demand zone
strong -
$2,320 – Intraday low today, minor support
moderate
📉 Resistance Levels:
-
$2,400 – Horizontal overhead resistance, prior consolidation base
moderate -
$2,550 – Near-term channel top and 23.6% fib retracement
weak
Trading Zones (medium risk tolerance)
🎯 Entry Zones:
-
$2,320 – Bounce from strong support amid sequencer news positivity, low-risk long setup
medium risk -
$2,355 – Break above today’s high for confirmation, medium risk add
medium risk
🚪 Exit Zones:
-
$2,400 – First profit target at resistance
💰 profit target -
$2,550 – Extended target on channel break
💰 profit target -
$2,280 – Tight stop below support low
🛡️ stop loss
Technical Indicators Analysis
📊 Volume Analysis:
Pattern: climax decline on breakdown, now contracting
High volume on Apr 12 drop signals exhaustion, lower volume on rebound suggests weakening sellers
📈 MACD Analysis:
Signal: bearish but diverging (price lower lows, MACD higher low)
Momentum slowing despite price drop, potential bullish crossover setup
Applied TradingView Drawing Utilities
This chart analysis utilizes the following professional drawing tools:
Disclaimer: This technical analysis by Market Analyst is for educational purposes only and should not be considered as financial advice.
Trading involves risk, and you should always do your own research before making investment decisions.
Past performance does not guarantee future results. The analysis reflects the author’s personal methodology and risk tolerance (medium).
Blending these seven pillars – from cost-aware caps to vigilant monitoring – equips Ethereum sequencer markets participants for endurance. Rollup operators embracing dynamic adjustments and MEV uplifts alongside diversification sidestep the pitfalls of centralized sequencing ghosts. In my 14 years managing risks, the formula holds: calibrate bids to realities, not hype. Node providers auctions evolve fast, but disciplined strategies on shared platforms yield resilient operations, fortifying L2 ecosystems against outages and censorship. Operators tuning these now position for the decentralized sequencing surge ahead.